Tidying up MCMC output can be a real pain. There are plenty of packages that help with summarising MCMC and providing their own summaries, but sometimes you just want a tidy datastructure so you can do your own thing. And quickly.
mmcc provides tidying functions that return tidy data structure from mcmc.list objects. It uses data.table as the backend for speediness, it also provides broom tidiers to assist in some quick summaries.
Usingage mmcc
mcmc_to_dt takes an mcmc.list object and turns it into a data.table of the format:
library(coda)
data(line)

head(data.frame(line$line1))
#>     alpha      beta     sigma
#> 1 7.17313 -1.566200 11.233100
#> 2 2.95253  1.503370  4.886490
#> 3 3.66989  0.628157  1.397340
#> 4 3.31522  1.182720  0.662879
#> 5 3.70544  0.490437  1.362130
#> 6 3.57910  0.206970  1.043500
library(mmcc)

mcmc_dt <- mcmc_to_dt(line)

mcmc_dt
#>       iteration chain parameter    value
#>    1:         1     1     alpha 7.173130
#>    2:         2     1     alpha 2.952530
#>    3:         3     1     alpha 3.669890
#>    4:         4     1     alpha 3.315220
#>    5:         5     1     alpha 3.705440
#>   ---
#> 1196:       196     2     sigma 1.306930
#> 1197:       197     2     sigma 0.846828
#> 1198:       198     2     sigma 0.465129
#> 1199:       199     2     sigma 0.672417
#> 1200:       200     2     sigma 0.639787
tidy.mcmc.list takes an mcmc.list, turns it into a data.table and summarises it in terms of each parameter’s mean, median, standard deviation and credible interval with level given by conf.level:
tidy(line)
#>    parameter      mean        sd      2.5%    median    97.5%
#> 1:     alpha 2.9875644 0.4983950 1.9650403 3.0188300 3.876589
#> 2:      beta 0.7991864 0.3366834 0.1430713 0.7962500 1.469723
#> 3:     sigma 0.9680519 0.7413014 0.4249618 0.7911975 2.559520
We can also optionally ask for a subset of the parameters with a vector of colnames and summarise for each chain:
tidy(line,
     chain = TRUE,
     colnames=c("alpha"))
#>    parameter chain     mean        sd     2.5%   median    97.5%
#> 1:     alpha     1 2.982615 0.5313900 2.085719 2.973115 3.838839
#> 2:     alpha     2 2.992514 0.4643476 1.965040 3.063630 3.890256
This may be useful if we want to make a plot that shows how a given parameter varies from chain to chain.
library(ggplot2)

line_tidy <- tidy(line, chain = TRUE)

ggplot(data = line_tidy,
       aes(x = factor(chain),
           y = mean)) +
    geom_pointrange(aes(ymin = `2.5%`,
                        ymax = `97.5%`)) +
    facet_wrap(~parameter,
               nrow = 1,
               scales = "free_y") +
    theme_bw() +
    xlab("Chain") +
    ylab("Value")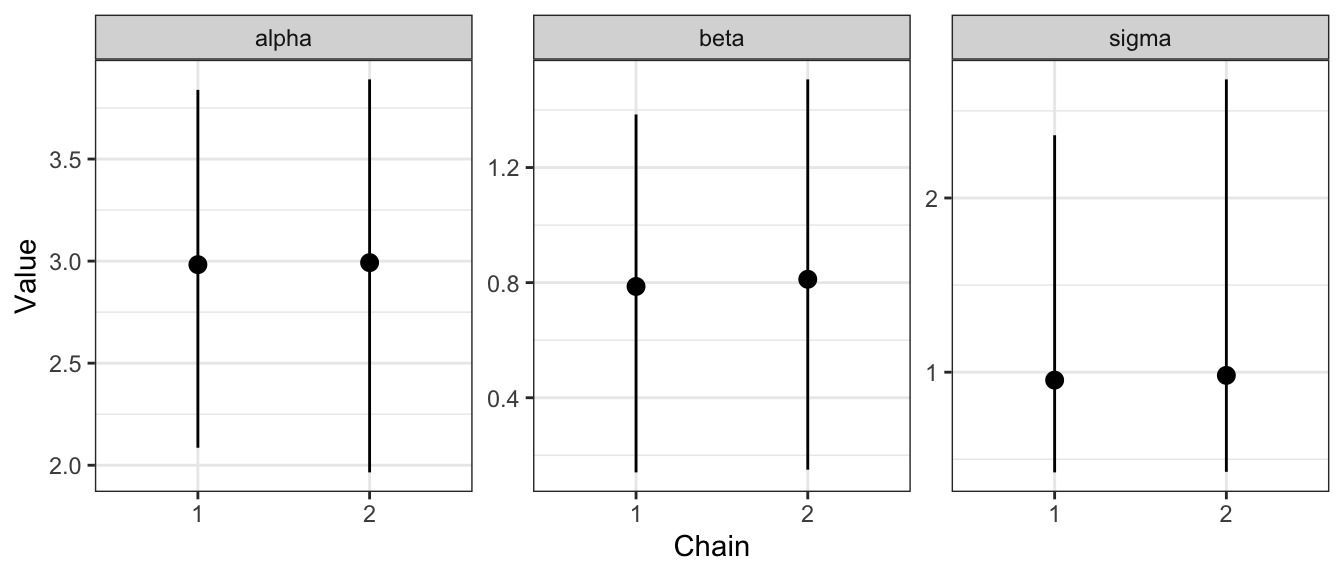
Why mmcc?
Full credit does to Sam Clifford for the name.
To quote Sam:
…it’s all about reshaping and manipulating mcmc chains…
…therefore, mmcc
Future work
- Create summaries for each parameter
- Perform diagnostic summaries for convergence
- provide a suite of plotting in plotly, for speed, and interactivity.
Code of Conduct
Please note that this project is released with a Contributor Code of Conduct. By participating in this project you agree to abide by its terms.

